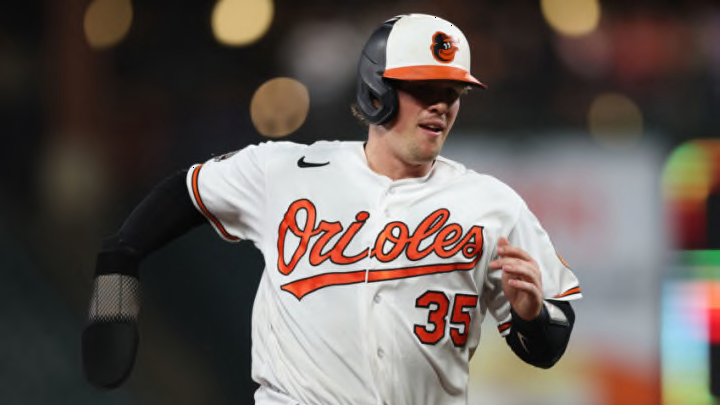
The Orioles 2019 draft picks rank highly in a range of statistics.
Orioles fans, it’s been a season to remember, and it is only going to get better from here. For us older fans, this season reminds us of the “Why Not?” Orioles of 1989 when they started the 1988 season 0-21 and nearly won the division in 1989. Back then the 1988 Orioles were in shambles, and the team was never able to rebound. They had two future Hall of Famers, Eddie Murray and Cal Ripken, who despite all of the accolades couldn’t get the team back on track. In 1989, it was a trip back to the drawing board, and a deeper examination into what hurt them on the field and on the scoreboard.
The losses had taken the fun away from the game, and the team suffered on and off the field. What was their solution? Tape ball. A game consisting of a shorter field with a tightly wound ball of tape. Games would take place when everyone had left Memorial Stadium and it was just the players. No pressure, no weight, just players having fun.
That’s what we have here with the 2022 Baltimore Orioles. We have a team that is out there having fun and putting it all together – one piece at a time.
The number of players making their debut and the up-and-coming players working their way through the system is what is making this team fun to watch. Where it becomes even more exciting is seeing how the three rookies on the team compare to MLB averages.
These stats are as of Saturday, September 10.
Kyle Stowers has 15 games under his belt and has a Hard Hit % of 48.3, which means nearly 50% of all hits off of his bat at least 95 MPH or more, where the league average is 38.3. This can also be tied to his BABIP of .321. At the plate, the hits are at coming off the sweet spot of the bat 41.4% of the time as compared to the league average of 33%. His K% is a bit higher at this level, 31.3%, and the league average is 22%. As an add on, during the September 3 game against the Oakland A’s, playing RF, he threw a ball from just in front of the right field scoreboard that hit the top of the net behind Adley Rutschman. With more plate appearances, we should see some strong at-bats from him in the future, and some amazing plays at the plate.
Gunnar Henderson has only played in 10 games in Baltimore, and already ranks in the 90th percentile in sprint speed. Through the 10 games, Henderson has registered a Sprint Speed of 29.0, which means he covers 29 ft/second. To give you an idea of how fast that it, Jorge Mateo ranks in the 99th percentile with 30.2. Henderson’s exit velocity averages 90.7 on each hit, where the league average is 88.7, and his Hard Hit % is 42.9. With a very small sample of 39 plate appearances, Gunnar has a slash line of .306/.359/.472 with an OPS of .831.
The backbone of the O’s newfound success is Adley Rutschman, who has been able to create a better environment for pitcher’s finesse, and the team’s prowess on and off the field. On defense Rutschman has a Frame Rate in the 88th percentile. Frame rate is the art of framing a pitch to appear as a strike to the umpire. Adley has a strike rate of 50%, while the league leader is Jose Trevino with 54%. Rutschman’s pop time to second base ranks in the 83rd percentile, which puts him 10th in MLB, and his arm is rated at 86.6 MPH, which places him 6th in the league. His defensive presence has helped lead the Orioles pitching staff to a 3.44 ERA while he is behind the plate.
On the other side of the plate, Rutschman is in the 96th percentile in BB%, and has a max exit velocity in the 73rd percentile. It has peaked at 110.9 this season, and he has a slash line of .253/.361/.446 with an OPS of .807. Had he the minimum plate appearances, he would rank 5th in OPS for all catchers in Major League Baseball, and his Slugging Percentage of .446 would rank 4th.
The future is here in Baltimore. Get ready to ride the Orioles for a long time.
