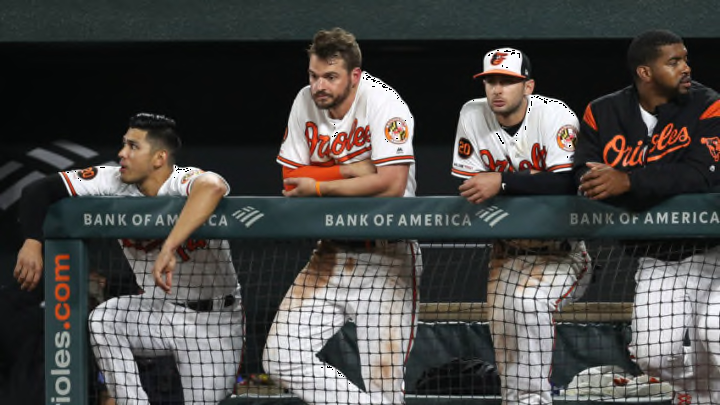
Which players have helped the Baltimore Orioles the most this season? Who has hurt this team the most? Let’s dive in and find out.
The 2019 season started on such a high note for the Baltimore Orioles. With a brand new regime leading the way and a fresh face taking charge in the dugout, the Orioles hit the road to begin 2019, earning series wins against the New York Yankees and Toronto Blue Jays. We all knew this success wasn’t going to last, but life was good for a short while.
Since then, this team has crashed back to reality. With a 15-36 record, Baltimore now holds the worst record in the major leagues and remains on track to not just break, but completely shatter the major league record for home runs allowed in a single season.
The Cincinnati Reds allowed 256 home runs back in 2016, however, the Baltimore Orioles are on pace to surrender more than 300 round-trippers in 2019 and have already become the team quickest to give up 100, completing that in game 48 of the season. While the 2019 season seems to be flying by, there are still 100-plus games remaining on the schedule. Hold on tight.
There are many different statistics we can use to see who is performing well and who is struggling. Many of these numbers are solid indicators of future production and can be used to predict the odds of a future event happening, but for the purposes of this piece, I want to look back at what has already happened.
Wins Probability Added is a fun number we can use to see which players have helped swing the odds of a win more in favor of the Orioles. When calculating batting average, all hits count the same. When calculating slugging percentage, all home runs are equal. How do we differentiate between a single when a player’s team is up 10-2 in the 8th inning from a single in the ninth inning of a tied game? Wins Probability Added will do just that.
From Fangraphs, “Win Probability Added (WPA) captures the change in Win Expectancy from one plate appearance to the next and credits or debits the player based on how much their action increased their team’s odds of winning.” For example, let’s say the Orioles have a 40% chance of winning a particular game and Chris Davis bats in the sixth inning, hits a home run, and increases the O’s chances of winning to 55%. In this scenario, Davis adds 0.15 to his WPA (in return, the pitcher he hit the home run off of will have 0.15 subtracted from his WPA).
If Davis comes up to bat with the Orioles holding a 95% chance of winning the game, hits a home run, and increases the odds to 96%, he adds just .01 to his WPA. It’s a pretty simple formula which takes the game scenario into account. I particularly like this line from the Fangraphs explanation linked above- “It doesn’t tell you how well a player performed, it tells you how important their performance was.”
With that in mind, let’s look at which players on this Baltimore Orioles roster have been the most important.
